
From Africa/Climate & energy tech/Nigeria · South Africa
We ran the Ibadan solar forecast ourselves. Every number came back.
We downloaded the code behind a solar forecasting paper and ran it again. All nine published figures matched. Then we measured the one thing the paper does not.
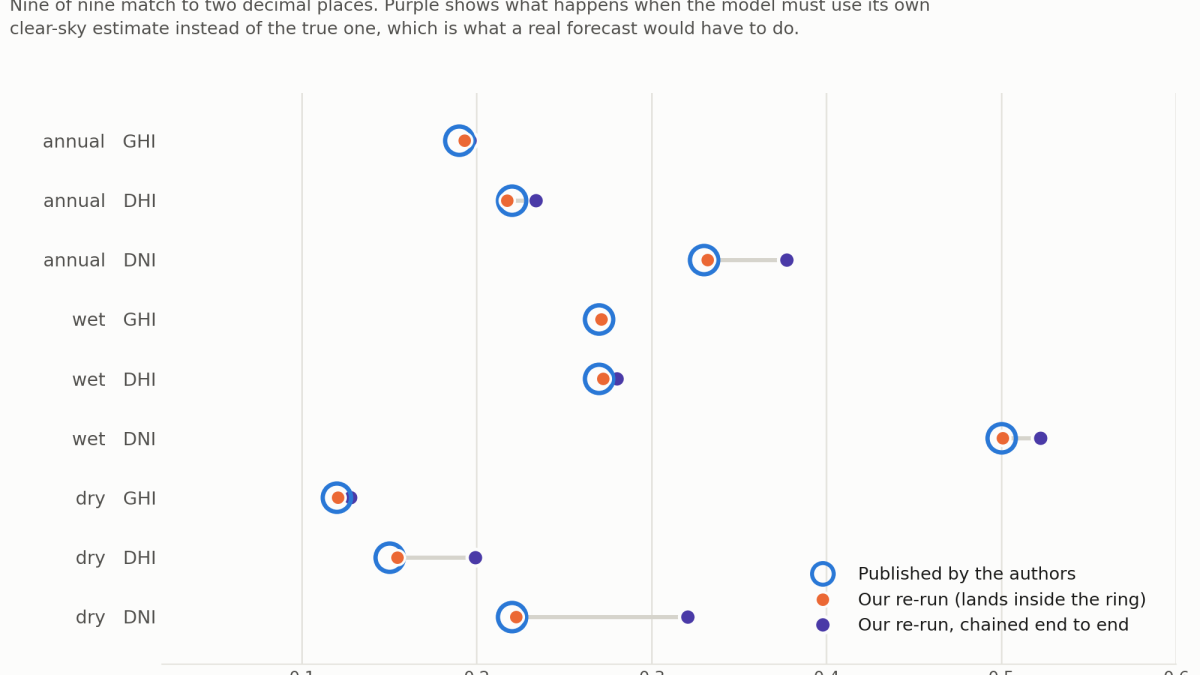
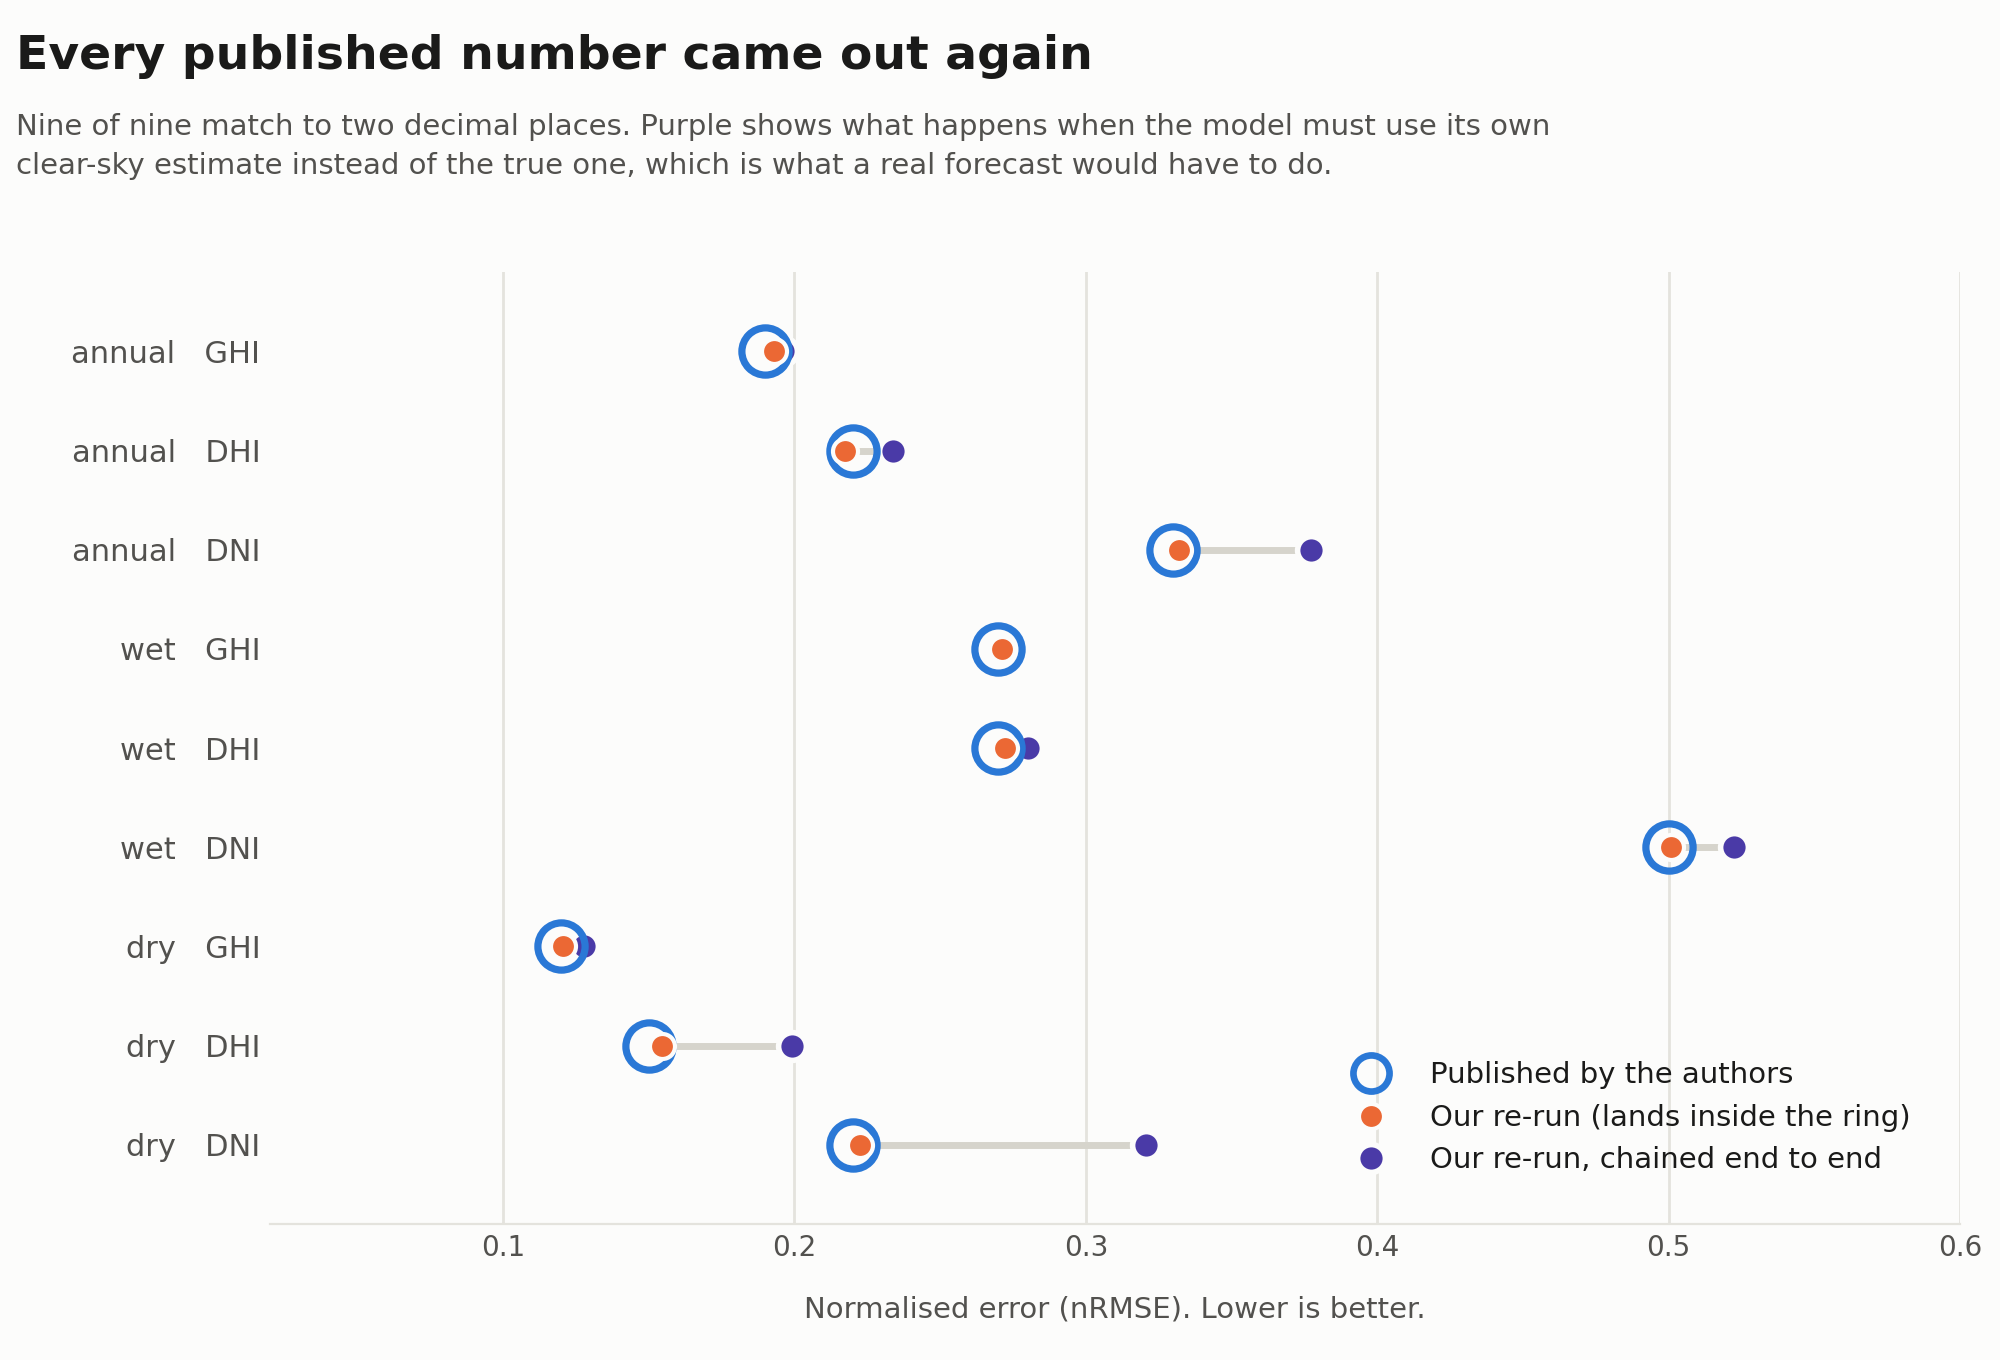
We re-ran the code behind a 2025 preprint that forecasts sunlight in Ibadan from weather records alone. All nine published error figures came back, matching to two decimal places. Verdict: reproduced. But when we chained the two stages the way a real forecast must, the dry-season direct-beam error rose from 0.22 to 0.32.
A researcher publishes a number. A blog repeats it. Nobody ever checks. That is how almost all technology writing works, including ours until today.
So we checked one. We downloaded the code and the data behind a 2025 preprint that forecasts sunlight in Ibadan from ordinary weather records, and we ran it again on our own machine.
Verdict: Reproduced. All nine published error figures came back, matching to two decimal places. Then we asked a question the paper does not ask, and the answer changes how you should read its best result.
What the paper claimed
Researchers at the University of Ibadan in Nigeria and the University of Venda in South Africa forecast hourly sunlight in Ibadan using nothing but weather records. Temperature. Humidity. Pressure. Wind. No sensor on a roof anywhere.
A Random Forest beat both a CNN and an LSTM. Across a full year its normalised error on total sunlight was 0.19. In the dry season it fell to 0.12. In the wet season it rose to 0.27.
We covered that paper and scored it 4 out of 10. It is a preprint, it uses one site, and nobody else had checked it.
What we did
The authors published their code and all eighteen years of their data on GitHub. Therefore we could simply run it.
We cloned the repository. We retrained the Random Forest exactly as their notebook does. We used the same error measure on the same test split. We changed nothing about the method. We changed one thing. We let the trees build on two cores instead of one. That changes how long it takes, not what comes out.
One thing is worth knowing before you try it yourself. The repository does not contain the trained models. They are excluded by the project’s own ignore file. Therefore you have to retrain from the data, which takes about four minutes.
What came back
All nine numbers. Annual, wet season and dry season, across all three kinds of sunlight, every figure matched the published one to two decimal places.
This is rarer than it sounds. Most published results of this kind cannot be rerun at all. The code is missing, or the data is private, or the versions have moved on. This one ran first time.
| Season | Measure | Published | Our re-run | Chained end to end | Penalty |
|---|---|---|---|---|---|
| annual | GHI | 0.19 | 0.1931 | 0.1959 | 1.4% |
| annual | DHI | 0.22 | 0.2173 | 0.2337 | 7.5% |
| annual | DNI | 0.33 | 0.3319 | 0.3774 | 13.7% |
| wet | GHI | 0.27 | 0.2711 | 0.2715 | 0.1% |
| wet | DHI | 0.27 | 0.2724 | 0.2800 | 2.8% |
| wet | DNI | 0.50 | 0.5007 | 0.5226 | 4.4% |
| dry | GHI | 0.12 | 0.1204 | 0.1277 | 6.1% |
| dry | DHI | 0.15 | 0.1544 | 0.1992 | 29% |
| dry | DNI | 0.22 | 0.2226 | 0.3208 | 44.1% |
The question the paper does not ask
The model works in two stages. The first stage predicts clear-sky sunlight from weather. The second stage predicts real, cloudy sunlight. It uses the weather, the cloud type, and those clear-sky figures.
However, when the authors measure the second stage, they feed it the true clear-sky values out of the dataset. A real forecast does not have those. It only has whatever the first stage guessed.
So we measured it again, chaining the two stages the way a real forecast must.
The headline figure holds. Total sunlight over a year moves from 0.193 to 0.196. That is a penalty of 1.4 percent and it is nothing.
The direct beam is a different story. Over a year its error rises from 0.33 to 0.38. In the dry season, which is the paper’s best result, it rises from 0.22 to 0.32. That is a penalty of 44 percent on the number that looks strongest.
This is because the dry season leans hardest on the clear-sky stage. When the sky is clear, almost all the answer comes from that stage. Therefore an error there passes straight through. In the wet season the clouds dominate anyway, so a wobble in the clear-sky estimate matters less.
Note that our chained figure is, if anything, flattering. The first-stage model had seen some of the rows we tested. A stricter test would separate them, and the penalty would be larger, not smaller.
What this means if you are building something
If you want a yearly energy estimate for a solar installation in Ibadan, this method works and you can use it today. Total sunlight is what sizes a system, and it survives.
If you want to know how much sun will hit a tracking array on a clear day in January, be more careful. That is the direct beam, and the published dry-season figure is measured under conditions a real forecast does not get.
Why the score does not move
We expected to raise it. We are not going to, and the reason is worth saying out loud.
Our rubric has five parts. Peer review, labs, evidence type, open code, and community signal. Read that list again and see what is missing. None of them is about whether anybody has ever checked the result.
We could have quietly nudged the evidence score from 1 to 2 and called it progress. That would inflate a number by changing what it means. That is the exact behaviour this site exists to catch in other people.
So the score stays at 4, and the rubric is what needs fixing. We are adding a verification part to it. When we do, every score on this site changes, and every change will appear in the ledger with a date.
What would change our verdict
A second site. If this method reaches the same accuracy in Kano or Kumasi, it stops being a result about Ibadan and starts being a method. That, with peer review, would move it to 7.
One rerun by one publication is not replication. We ran their code. We did not collect new data.
How to check us
Paper: arXiv:2508.07462. Code and data: github.com/peterobarotu/Solar_Energy_Forecasting, licensed CC BY 4.0. Note that the paper itself names no licence, but the repository does.
We ran it on Python 3, scikit-learn 1.8.0, pandas 3.0.2, on two cores. The whole run took under four minutes. Every number in the table above is in the results file we kept, and the script is the notebook’s own method with nothing added.
If you run it and get something different, tell us and we will publish the correction.
Source: Solar Radiation Forecasting and Photovoltaic System Modelling for Ibadan, Nigeria, August 2025. arXiv:2508.07462 · arxiv.org (preprint · not yet peer reviewed).
- All nine published error figures reproduced to two decimal places, which almost no machine-learning result does.
- The headline yearly figure for total sunlight survives end to end, moving only from 0.193 to 0.196.
- The paper’s best-looking number does not: the dry-season direct beam goes from 0.22 to 0.32 once the model must use its own clear-sky estimate.
One site, one dataset, and a method we have now run ourselves. Running somebody’s code is not the same as another group collecting new data, so this stays at Lab.
Questions people ask
Did the paper’s numbers hold up?
Yes. All nine figures matched to two decimal places on our own machine.
What is the catch?
The paper measures its second stage using true clear-sky values from the dataset. A real forecast does not have those. Chained properly, the direct beam gets worse, most of all in the dry season.
Can I use this to size a solar system in Ibadan?
Yes. Total sunlight is the figure that sizes a system and it holds up. Be careful with the direct beam if you are planning a tracking array.
Did the score go up?
No. Our rubric has no part for whether anyone has checked a result. We are fixing the rubric rather than bending a number.

Mark Alex
Mark Alex is the founder and Managing Director of Real Biz Digital, a technology company operating out of Nairobi since 2018. He works in agentic AI and the Model Context Protocol, AI governance, enterprise software architecture and cybersecurity. He holds an MSc in Mechatronical Engineering from Obuda University in Budapest and a BSc in IT, Forensic Technology and Cybercrime, from USIU-Africa in Nairobi, and has published IEEE conference research on an AI-powered digital twin for greenhouse systems. He is the author of seven books. Between 2020 and 2024 he mentored more than 200 university students and interns in Nairobi. He writes every Just Out Tech article from the original research paper.